Building the Account at a Glance HTML5 jQuery Application by Dan Wahlin
Building the Account at a Glance HTML5 jQuery Application by Dan Wahlin
As Web technologies continue to evolve developers are required to learn new technologies in order to build successful web-based applications that stand above the crowd. This can be a challenging proposition especially for developers moving from desktop or Rich Internet Application (RIA) development frameworks. To help developers learn the latest HTML5, CSS3 and JavaScript technologies, we built a sample application for demonstration at Microsoft’s MIX 11 conference called “Account at a Glance” (download the app below) which we’re now able to (finally) release. The application takes advantage of key web technologies and uses them to display brokerage account information to consumers.
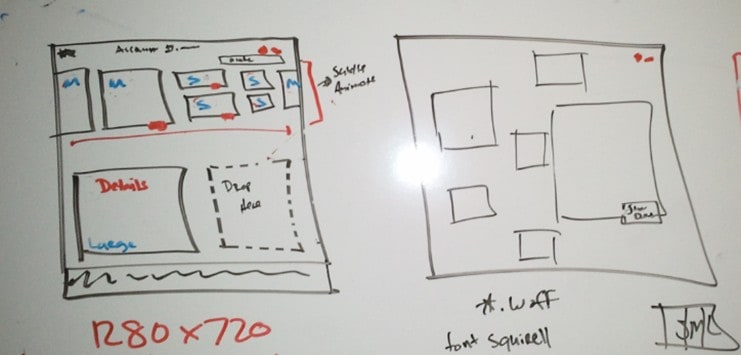
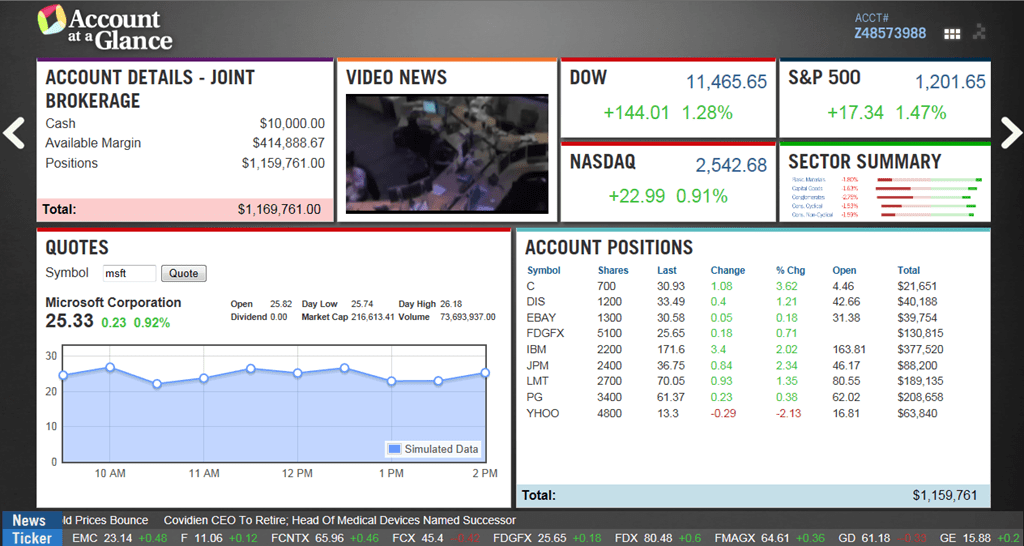
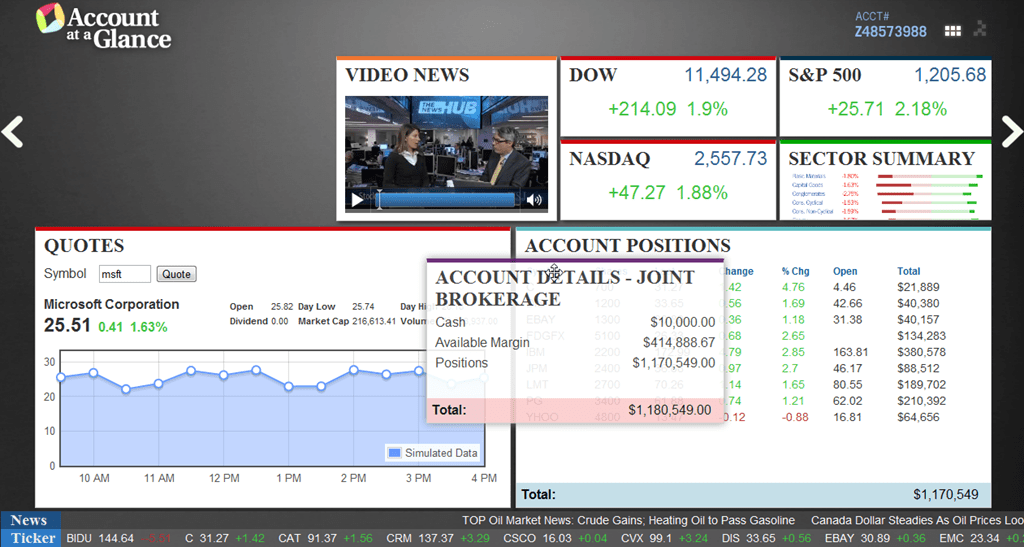
The application was built in Q1 of 2011 by Dan Wahlin (client-side and server-side coding), Corey Schuman (design and client-side coding), Jarod Ferguson (client-side coding), and John Papa (Entity Framework Code-First coding). John Papa, Giorgio Sardo and Scott Guthrie also provided feedback and offered several key suggestions and ideas that were incorporated into the application. Figure 1 shows the Account at a Glance application as it was first conceived on the whiteboard and how it ended up after the project was completed.
Figure 1. The Account at a Glance application screen.
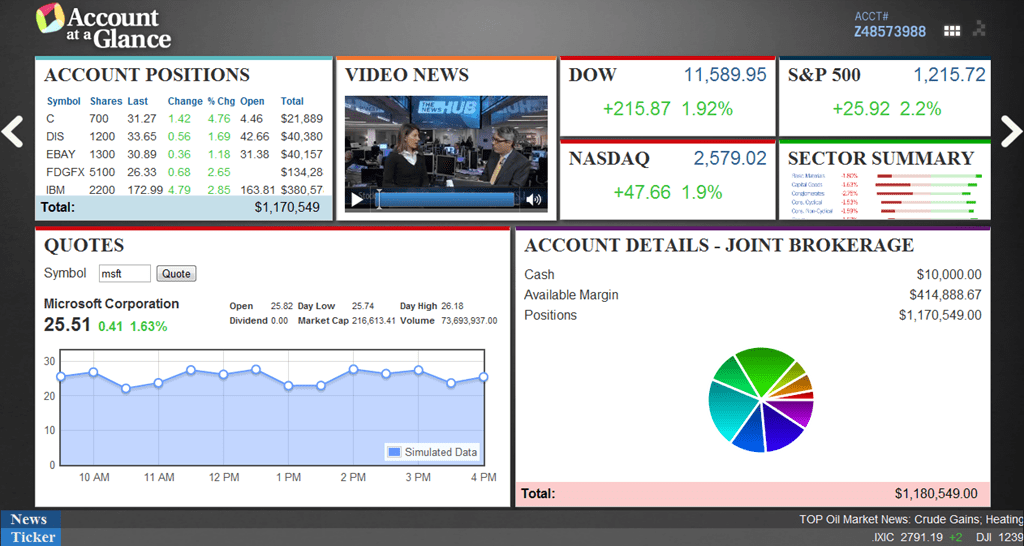
The Account at a Glance application was built to demonstrate how cutting-edge web technologies can be used together to build a dynamic application capable of displaying account information, video news, quotes and charts, markets news and more without the use of plug-ins. It loads data dynamically using AJAX technologies into tiles that are displayed within the application. As tiles are dragged and dropped to different locations in the interface data is re-rendered depending upon the size of the tile that is targeted (small, medium and large tile sizes exist – see Figure 2). This allows data to be displayed in several different ways and provides a means for customers to customize how account information is displayed by moving tiles around.
Figure 2. Tiles can be dragged to different areas of the screen and are automatically resized using jQuery templates as shown in the two images above.
Technologies used in the Account at a Glance application include:
- HTML5 features
- Modernizer
- HTML5 Boilerplate
- jQuery along with several jQuery plug-ins
- jQuery Templates
- Canvas
- SVG
- CSS3
- JSON and AJAX technologies
- ASP.NET MVC 3
- Entity Framework 4.1 Code-First
- Repository Pattern for data access
- Unity IoC Container
- SQL Server 2008
- Nuget
This document provides an overview of the Account at a Glance application and illustrates how different web technologies can be used together.
Account at a Glance Solution
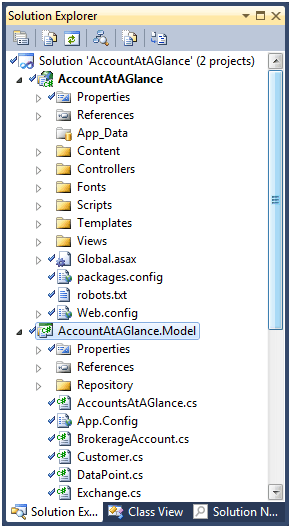
The Account at a Glance application is comprised of a single solution with two projects. The first project is named AccountAtAGlance and uses the ASP.NET MVC 3 project template while the second is named AccountAtAGlance .Model and is a Class Library project. Figure 3 shows the solution and project structure.
Figure 3. The Account at a Glance solution.
The AccountAtAGlance project follows the standard ASP.NET MVC 3 folder structure. The Controllers folder contains the controller classes used in the application while the views are located in the Views folder. The Account at a Glance application relies heavily on client-side technologies such as jQuery and the scripts used in the application can be found in the Scripts folder. Several different jQuery plugins were used to create the application such as jQuery UI, Flot (Canvas rendering), Raphael (SVG rendering), and DataTables. JSON data is exchanged between the client browser and server using ASP.NET MVC actions and rendered using jQuery Templates that are dynamically loaded from the server. CSS is used heavily throughout the application including several CSS3 features. The .css files can be found in the Content folder.
Data access functionality can be found in the AccountAtAGlance.Model project. The project contains the code-first classes that define the structure of model classes used throughout the application as well as a DbContext class named AccountAtAGlance.cs. The Repository folder contains data access classes that perform Create, Read, Update and Delete (CRUD) operations on behalf of the application. LINQ technologies are used in the application to simplify the data access code and provide filtering and sorting functionality. The application makes RESTful service calls to ASP.NET MVC 3 actions that expose data and objects defined in the AccountAtAGlance.Model project. It also calls out to a Google financial service to retrieve stock quotes and also simulates random market index quotes on a timed basis.
The following sections provide an overview of how several different technologies are used in the Account at a Glance application.
Code-First and the Repository Pattern
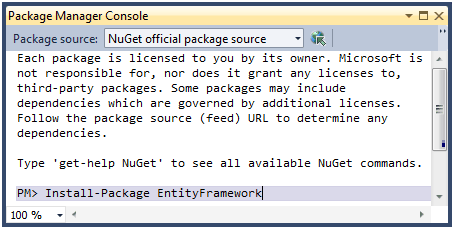
When we started out building the Account at a Glance application Entity Framework 4.0’s Model-First option was used. However, Entity Framework Code-First was about to be released so we converted to that technology in the middle of the project (thanks to Scott Guthrie for the suggestion to go with code-first and John Papa for doing the conversion from model-first). If you’re new to code-first, Entity Framework 4.1 provides a code-first approach that shifts the focus to working with POCO (Plain Old CLR Objects) objects which keeps your data model classes nice and clean. To use code-first you can install Nuget (http://nuget.org), go to View –> Other Windows –> Package Manager Console and type Install-Package EntityFramework at the prompt as shown in Figure 4.
Figure 4. Using the Nuget Package Manager Console to install Entity Framework 4.1 and code-first.
POCOs are used to define entities used in the application. Listing 1 shows an example of the BrokerageAccount POCO class that defines several different properties as well as 3 navigation properties.
namespace AccountAtAGlance.Model
{
public class BrokerageAccount {
public BrokerageAccount()
{
Positions = new HashSet<Position>();
Orders = new HashSet<Order>();
}
// Primitive properties public int Id { get; set; }
public string AccountNumber { get; set; }
public string AccountTitle { get; set; }
public decimal Total { get; set; }
public decimal MarginBalance { get; set; }
public bool IsRetirement { get; set; }
public int CustomerId { get; set; }
public decimal CashTotal { get; set; }
public decimal PositionsTotal { get; set; }
public int WatchListId { get; set; }
// Navigation properties public ICollection<Position> Positions { get; set; }
public ICollection<Order> Orders { get; set; }
public WatchList WatchList { get; set; }}
}
}
Listing 1. The BrokerageAccount Class
POCO classes defined in the application are used to automatically generate the database used by the application and a class named AccountAtAGlance that derives from DbContext is used to query the database as shown in Listing 2. This class is located in the AccountAtAGlance.Model project’s Repository folder.
using System.Data.Entity;
namespace AccountAtAGlance.Model.Repository
{
public class AccountAtAGlance : DbContext {
public AccountAtAGlance() : base(“name=AccountAtAGlance”) { }
public DbSet<BrokerageAccount> BrokerageAccounts { get; set; }
public DbSet<Customer> Customers { get; set; }
public DbSet<Exchange> Exchanges { get; set; }
public DbSet<MarketIndex> MarketIndexes { get; set; }
public DbSet<Order> Orders { get; set; }
public DbSet<OrderType> OrderTypes { get; set; }
public DbSet<Position> Positions { get; set; }
public DbSet<Security> Securities { get; set; }
public DbSet<MutualFund> MutualFunds { get; set; }
public DbSet<Stock> Stocks { get; set; }
public DbSet<WatchList> WatchLists { get; set; }
public int DeleteAccounts()
{
//return base.Database.SqlCommand(“DeleteAccounts”); return base.Database.ExecuteSqlCommand(“DeleteAccounts”);
}
public int DeleteSecuritiesAndExchanges()
{
return base.Database.ExecuteSqlCommand(“DeleteSecuritiesAndExchanges”);
}
protected override void OnModelCreating(DbModelBuilder modelBuilder)
{
// base.OnModelCreating(modelBuilder); // inherited table types // Map these class names to the table names in the DB modelBuilder.Entity<Security>().ToTable(“Securities”);
modelBuilder.Entity<Stock>().ToTable(“Securities_Stock”);
modelBuilder.Entity<MutualFund>().ToTable(“Securities_MutualFund”);
// Many to many resolver // Map the WatchList and Securities navigation property using // the WatchListSecurity Many-to-Many table. // To avoid a Cycle condition, WatchList has Securities, // but Security does not have WatchLists. modelBuilder.Entity<WatchList>().HasMany(w => w.Securities).WithMany() // (w => w.Securities) .Map(map => map.ToTable(“WatchListSecurity”)
.MapRightKey(“SecurityId”)
.MapLeftKey(“WatchListId”));
}
}
}
Listing 2. The AccountAtAGlance class is used to query the database.
The AccountAtAGlance class relies on the new fluent API to map some POCO classes to database tables such as mapping Security to Securities and Stock to Securities_Stock. This is accomplished by overriding the OnModelCreating() method and defining the necessary mappings.
Classes that follow the Repository Pattern are located in the Repository folder of the AccountAtAGlance .Model project. Several different classes are provided to handle various query functionality. Listing 3 shows a section of the AccountRepository class that handles querying customer account information. It uses the AccountAtAGlance DbContext class to perform the query.
1 2 3 4 5 6 7 8 9 10 11 12 13 14 | <span style="color: blue;">namespace </span>AccountAtAGlance.Model.Repository { <span style="color: blue;">public class </span><span style="color: #2b91af;">AccountRepository </span>: <span style="color: #2b91af;">RepositoryBase</span>&lt;<span style="color: #2b91af;">AccountAtAGlance</span>&gt;, <span style="color: #2b91af;">IAccountRepository </span>{ <span style="color: blue;">public </span><span style="color: #2b91af;">Customer </span>GetCustomer(<span style="color: blue;">string </span>custId) { <span style="color: blue;">using </span>(<span style="color: blue;">var </span>context = DataContext) { <span style="color: blue;">return </span>context.Customers .Include(<span style="color: #a31515;">"BrokerageAccounts"</span>) .Where(c =&gt; c.CustomerCode == custId).SingleOrDefault(); } } } } |
Listing 3. The AccountRepository class uses the DbContext to query the database for customer account information.
Client-Side Object Framework
Account at a Glance has a client-side layout framework that is responsible for animating tiles, performing drag and drop operations and changing between scenes. The application initially loads with a “cloud-view” scene and then dynamically changes to the scene shown earlier in Figure 1. The key files used in the client-side framework include:
| Script | Purpose |
| scene.startup.js | Performs start-up logic and animations. It also handles switching between tile scenes. |
| scene.layoutservice.js | Defines two different tile scenes including the one shown in Figure 1 as well as a “cloud-view” scene that is shown when the application first loads. Details about formatting tiles, positions, colors and more is defined in this script using JSON objects. |
| scene.statemanager.js | The engine that handles creating tiles dynamically at runtime as well as drag and drop functionality and changes between scenes. |
| scene.dataservice.js | Handles performing AJAX calls to the server. As JSON data is retrieved, callback functions are invoked that process the data. This script is similar to a proxy object used to call services in other application frameworks. |
| scene.tile.binder.js | Handles converting JSON data into HTML for each tile’s size (small, medium and large). This script relies heavily on jQuery templates to bind JSON data to HTML templates that are dynamically downloaded from the server using the jQuery get() AJAX function. |
| scene.tile.renderer.js | Tiles created within scene.tile.binder.js are rendered using this script depending upon what tile size is requested. This script doesn’t know how to get the data or HTML for a tile template. It’s responsible for placing templates into the appropriate container within the page and calling any required formatters to provide custom formatting functionality. |
| scene.tile.formatter.js | Several tiles require custom formatting after they have been rendered by scene.tile.renderer.js. For example, some decimal values need to be formatted as a currency and Canvas charts need to be generated for quote tiles. This script is called as tiles are rendered to handle formatting data, generating SVG and Canvas charts, plus more. |
Listing 4 shows the scene.tile.binder.js script that is used to convert JSON data retrieved from the server to HTML using jQuery templates. The TileBinder object (as well as others within the Account at a Glance application) follows the JavaScript Revealing Module Pattern detailed here.
1 2 3 4 5 6 7 8 9 10 11 12 13 14 15 16 17 18 19 20 21 22 23 24 25 26 27 28 29 | <span style="color: #006400;">//Handles loading jQuery templates dynamically from server //and rendering them based upon tile data </span><span style="color: blue;">var </span>TileBinder = <span style="color: blue;">function </span>() { <span style="color: blue;">var </span>templateBase = <span style="color: maroon;">'/Templates/'</span>, bind = <span style="color: blue;">function </span>(tileDiv, json, renderer) { <span style="color: blue;">var </span>tileName = tileDiv.attr(<span style="color: maroon;">'id'</span>); $.get(templateBase + tileName + <span style="color: maroon;">'.html'</span>, <span style="color: blue;">function </span>(templates) { $(<span style="color: maroon;">'body'</span>).append(templates); <span style="color: blue;">var </span>acctTemplates = [ tmpl(tileName, <span style="color: maroon;">'Small'</span>, json), tmpl(tileName, <span style="color: maroon;">'Medium'</span>, json), tmpl(tileName, <span style="color: maroon;">'Large'</span>, json) ]; tileDiv.data().templates = acctTemplates; tileDiv.data().json = json; renderer(tileDiv); }); }, tmpl = <span style="color: blue;">function </span>(tileName, size, json) { <span style="color: blue;">var </span>template = $(<span style="color: maroon;">'#' </span>+ tileName + <span style="color: maroon;">'Template_' </span>+ size); <span style="color: blue;">if </span>(json != <span style="color: blue;">null</span>) <span style="color: blue;">return </span>template.tmpl(json); <span style="color: blue;">else return </span>template.html(); }; <span style="color: blue;">return </span>{ bind: bind }; } (); |
Listing 4. Scene.tile.binder.js relies on jQuery templates to bind JSON data to HTML templates that are dynamically downloaded from the server for each tile used in the application.
The bind() function receives the tile that must be rendered, the JSON data used to render it, and a render object that handles placing rendered HTML into the appropriate container. It uses the jQuery get() function to call to the server and retrieve the small, medium and large templates for the tile. The different template sizes for a given tile are defined in a single file that lives within the AccountAtAGlance project’s Templates folder. An example of a template used to render the S&P 500 tiles is shown in Listing 5. The ${ token } token syntax found in each of the templates defines the JSON properties that should be bound once each template is rendered.
1 2 3 4 5 6 7 8 9 10 11 12 13 14 15 16 17 18 19 20 21 22 23 24 25 26 27 28 29 30 31 32 33 34 35 36 37 38 39 40 41 42 43 44 45 46 47 48 | <span style="color: blue;">&lt;</span><span style="color: maroon;">script </span><span style="color: red;">id</span><span style="color: blue;">="SP500Template_Small" </span><span style="color: red;">type</span><span style="color: blue;">="text/x-jquery-tmpl"&gt; </span>&lt;div class="content"&gt; &lt;header&gt; &lt;div class="Left"&gt;S&amp;P 500&lt;/div&gt; &lt;div class="MarketQuoteLast Right"&gt;${ SP500.Last }&lt;/div&gt; &lt;/header&gt; &lt;section&gt; &lt;div class="MarketQuoteDetails"&gt; {{tmpl '#SP500QuoteDetails_Template' }} &lt;/div&gt; &lt;/section&gt; &lt;/div&gt; <span style="color: blue;">&lt;/</span><span style="color: maroon;">script</span><span style="color: blue;">&gt; &lt;</span><span style="color: maroon;">script </span><span style="color: red;">id</span><span style="color: blue;">="SP500Template_Medium" </span><span style="color: red;">type</span><span style="color: blue;">="text/x-jquery-tmpl"&gt; </span>&lt;div class="content"&gt; &lt;header&gt; &lt;div class="Left"&gt;S&amp;P 500&lt;/div&gt; &lt;div class="MarketQuoteLast Right"&gt;${ SP500.Last }&lt;/div&gt; &lt;/header&gt; &lt;section&gt; &lt;div class="MarketQuoteDetails"&gt; {{tmpl '#SP500QuoteDetails_Template' }} &lt;/div&gt; &lt;div id="SP500Canvas" class="canvas"&gt;&lt;/div&gt; &lt;/section&gt; &lt;/div&gt; <span style="color: blue;">&lt;/</span><span style="color: maroon;">script</span><span style="color: blue;">&gt; &lt;</span><span style="color: maroon;">script </span><span style="color: red;">id</span><span style="color: blue;">="SP500Template_Large" </span><span style="color: red;">type</span><span style="color: blue;">="text/x-jquery-tmpl"&gt; </span>&lt;div class="content"&gt; &lt;header&gt; &lt;div class="Left"&gt;S&amp;P 500&lt;/div&gt; &lt;div class="MarketQuoteLast Right"&gt;${ SP500.Last }&lt;/div&gt; &lt;/header&gt; &lt;section&gt; &lt;div class="MarketQuoteDetails"&gt; {{tmpl '#SP500QuoteDetails_Template' }} &lt;/div&gt; &lt;div id="SP500Canvas" class="canvas"&gt;&lt;/div&gt; &lt;/section&gt; &lt;/div&gt; <span style="color: blue;">&lt;/</span><span style="color: maroon;">script</span><span style="color: blue;">&gt; &lt;</span><span style="color: maroon;">script </span><span style="color: red;">id</span><span style="color: blue;">="SP500QuoteDetails_Template" </span><span style="color: red;">type</span><span style="color: blue;">="text/x-jquery-tmpl"&gt; </span>&lt;span class="MarketQuoteChange"&gt;{{if parseFloat(SP500.Change) &gt; 0}}+{{/if}} ${ SP500.Change } &lt;/span&gt;&amp;nbsp;&amp;nbsp; &lt;span class="MarketQuotePercentChange"&gt;${ SP500.PercentChange }%&lt;/span&gt; <span style="color: blue;">&lt;/</span><span style="color: maroon;">script</span><span style="color: blue;">&gt; </span> |
Listing 5. HTML templates used along with jQuery template functionality to render the S&P 500 tiles.
The id of the tile determines which template file to download (convention is used for this functionality). Once the template for a given tile is downloaded it is added into the body of the page using the jQuery append() function and then each tile size is rendered by calling the tmpl function shown in Listing 4. As the different tile sizes are rendered they’re stored along with the JSON data in the tile using the jQuery data() function. The final step in the process is to call the tile renderer passed into the bind() function to load the appropriate tile size into the page.
Working with Canvas and SVG
HTML 5 enabled browsers such as Internet Explorer 9 and Chrome provide Canvas and SVG support that are used to generate charts used in the Account at a Glance application. The canvas tag can be used to render shapes, text and graphics using a pixel-based approach. The application uses the canvas tag to render stock quote charts. SVG relies on a variety of tags to render vector graphics and is used to generate a pie-chart for account positions within the application. Generating charts and graphs can be an involved process so the Account at a Glance application relies on 2 jQuery plugins to simplify the process. The scene.tile.formatter.js script contains the code to handle rendering canvas and SVG charts.
A jQuery plugin named Flot (http://code.google.com/p/flot/) is used to render stock quote charts in the application. It provides a significant boost to development productivity and can result in charts being created in only a few hours (including learning the programming interface – an example of building a simple Canvas chart is shown here). Figure 5 shows an example of the charts in action within the Quote tile and Listing 6 shows the code used to render the chart.
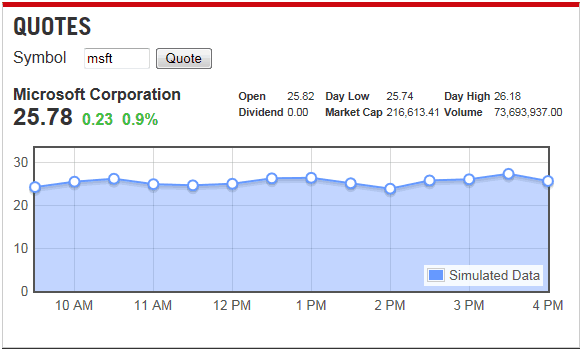
Figure 5. The Quote tile uses the canvas tag to render a stock quote chart.
1 2 3 4 5 6 7 8 9 10 11 12 13 14 15 16 17 18 19 20 21 22 23 24 25 26 27 28 29 30 31 32 33 34 35 36 37 38 39 40 41 42 43 44 45 46 47 | renderCanvas = <span style="color: blue;">function</span>(canvasDiv, width, height, color, itemJson, dataPointsJson) { <span style="color: blue;">if </span>(dataPointsJson != <span style="color: blue;">null </span>&amp;&amp; dataPointsJson.length &gt; 0) { <span style="color: blue;">var </span>quoteData = []; <span style="color: blue;">for </span>(<span style="color: blue;">var </span>i <span style="color: blue;">in </span>dataPointsJson) { <span style="color: blue;">var </span>dp = dataPointsJson[i]; quoteData.push([dp.JSTicks, dp.Value]); } <span style="color: blue;">var </span>maxY = itemJson.Last + (itemJson.Last * .3); <span style="color: blue;">var </span>chartOptions = { series: { lines: { show: <span style="color: blue;">true</span>, fill: <span style="color: blue;">true </span>}, points: { show: <span style="color: blue;">true</span>, radius: 5 } }, grid: { hoverable: <span style="color: blue;">true</span>, autoHighlight: <span style="color: blue;">true </span>}, legend: { position: <span style="color: maroon;">'se' </span>}, yaxis: { max: maxY, min: 0 }, xaxis: { minTickSize: [1, <span style="color: maroon;">'hour'</span>], mode: <span style="color: maroon;">'time'</span>, timeformat: <span style="color: maroon;">'%h %P'</span>, twelveHourClock: <span style="color: blue;">true </span>} }; canvasDiv.attr(<span style="color: maroon;">'style'</span>, <span style="color: maroon;">'width:' </span>+ width + <span style="color: maroon;">'px;height:' </span>+ height + <span style="color: maroon;">'px;'</span>); <span style="color: #006400;">//Required....css() doesn't work properly for this </span>$.plot(canvasDiv, [{ color: color, shadowSize: 4, label: <span style="color: maroon;">'Simulated Data'</span>, data: quoteData }], chartOptions); canvasDiv.bind(<span style="color: maroon;">'plothover'</span>, <span style="color: blue;">function</span>(event, pos, item) { <span style="color: blue;">if </span>(item) { <span style="color: blue;">if </span>(previousPoint != item.datapoint) { previousPoint = item.datapoint; $(<span style="color: maroon;">'#CanvasTooltip'</span>).remove(); <span style="color: #006400;">//var x = item.datapoint[0].toFixed(2), <span style="color: blue;">var </span>y = item.datapoint[1].toFixed(2); showTooltip(item.pageX, item.pageY, y); } } <span style="color: blue;">else </span>{ $(<span style="color: maroon;">"#CanvasTooltip"</span>).remove(); previousPoint = <span style="color: blue;">null</span>; } }); } } |
Listing 6. Using the Flot jQuery plugin to render a canvas chart.
Figure 6 shows the SVG chart displayed in the Account Details tile that is used to display security positions within the account. It’s generated using a jQuery plugin named Raphael (http://raphaeljs.com/) along with a specific Raphael plugin used to handle pie-charts (Raphael-pie.js in the project). Listing 7 shows the code that handles rendering the positions pie-chart.
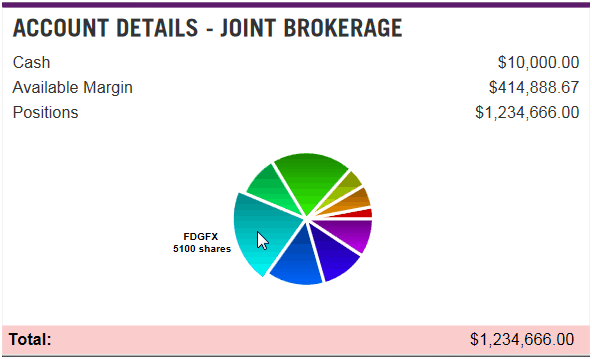
Figure 5. The SVG positions pie-chart displayed in the Account Details tile.
1 2 3 4 5 6 7 8 9 10 11 12 13 14 15 16 | formatAccountDetails = <span style="color: blue;">function</span>(tileDiv) { tileDiv.find(<span style="color: maroon;">'.Currency'</span>).formatCurrency(); <span style="color: blue;">var </span>scene = tileDiv.data().scenes[0]; <span style="color: blue;">if </span>(Modernizr.inlinesvg) { <span style="color: blue;">if </span>($(<span style="color: maroon;">'#AccountPositionsSVG'</span>).length &gt; 0) { <span style="color: blue;">var </span>values = []; <span style="color: blue;">var </span>labels = []; $(tileDiv.data().json.Positions).each(<span style="color: blue;">function</span>() { labels.push(<span style="color: blue;">this</span>.Security.Symbol + <span style="color: maroon;">'\r\n' </span>+ <span style="color: blue;">this</span>.Shares + <span style="color: maroon;">' shares'</span>); values.push(<span style="color: blue;">this</span>.Shares); }); raphael(<span style="color: maroon;">'AccountPositionsSVG'</span>, 500, 420).pieChart(scene.width / 2, scene.height / 4 + 10, 66, values, labels, <span style="color: maroon;">"#fff"</span>); } } } |
Listing 7. The Raphael jQuery plugin is used to render an SVG chart.
Integrating Video
Video is an important part of many web-based applications and is used in the Account at a Glance application to display video news (see Figure 7). The Video News tile relies on the new HTML5 video tag available in modern browsers to display a market news video. An example of using the video tag is shown next:
1 | <span style="color: blue;">&lt;</span><span style="color: maroon;">video </span><span style="color: red;">id</span><span style="color: blue;">="VideoPlayer" </span><span style="color: red;">controls</span><span style="color: red;">preload</span><span style="color: blue;">="auto" </span><span style="color: red;">poster</span><span style="color: blue;">="/content/images/video-poster.jpg"&gt; &lt;</span><span style="color: maroon;">source </span><span style="color: red;">type</span><span style="color: blue;">="video/mp4" </span><span style="color: red;">src</span><span style="color: blue;">=”…/031411hubpmmarkets_320k.mp4" /&gt; &lt;/</span><span style="color: maroon;">video</span><span style="color: blue;">&gt; </span> |
Figure 7. Displaying video.
Summary
The Account at a Glance application leverages several different HTML5 and JavaScript technologies to render stock and market quotes, customer account information, video and more. The application was built in less than 3 weeks by 2 developers and a designer. There’s still room for improvement in the application code-base but it provides a good start for learning how to integrate HTML5, Entity Framework code-first, ASP.NET MVC 3, jQuery, canvas, SVG, video and more in a single application.
Download
You can download the application here. Perform the following steps to run the application:
1. Extract the application files from the .zip archive. You’ll need Visual Studio 2010 with SP1 and a SQL Server 2008 database.
2. Locate the AccountsAtAGlance.exe file in the root folder and run it (you’ll need a SQL Server 2008 database). This will create a database named AccountsAtAGlance.
3. Locate the web.config file in the AccountAtAGlance project and update the connection string to point to the AccountsAtAGlance database you created in step 2.
Application FAQ
If I want to drag and drop a tile, where is that code?
Open Scripts/scene.statemanager.js to see the code that handles this functionality. For the drag and drop functionality, the code shown next is used. It’s located in the init() function. This code attaches the draggable and droppable jQuery functions to each tile.
1 2 3 4 5 6 7 8 9 | tileDiv.draggable({ opacity: 0.9, zIndex: 5000, revert: <span style="color: maroon;">'invalid'</span>, revertDuration: 500 }); tileDiv.droppable({ tolerance: <span style="color: maroon;">'pointer'</span>, drop: <span style="color: blue;">function </span>(event, ui) { swapTiles(ui.draggable, $(<span style="color: blue;">this</span>)); } }); |
The swapTiles() function is used to switch tile positions as one tile is dropped over another tile. This function handles mapping properties and animating tiles to their new positions.
If I want to update the stock prices, where do I look for that code?
Every 15 seconds the stock prices are updated. You’ll notice on the UI that the tile flashes with the new data letting the user know the data is updated. First take a look at the Scripts/scene.startup.js file. Look for this block of code:
1 2 3 4 5 | setInterval(<span style="color: blue;">function </span>() { <span style="color: blue;">if </span>(!windowFocused) <span style="color: blue;">return</span>; DataService.getMarketIndexes(renderMarketTiles); DataService.getAccount(acctNumber, renderAccountTiles); }, 15000); |
This sets up a timer to tick every 15 seconds (15000 milliseconds). When the timer ticks the getMarketIndexes() and getAccount() methods from the DataService execute (random values are always returned – even when the markets are closed). To see where the actual call is made open the Scripts/scene.dataservice.js file and look for the getMarketIndexes() method. Here you’ll see the “GetMarketIndexes” MVC action is being called. The data then gets processed by the jQuery template.
1 2 3 4 5 | <span style="color: blue;">var </span>getMarketIndexes = <span style="color: blue;">function </span>(callback) { $.getJSON(serviceBase + <span style="color: maroon;">'GetMarketIndexes'</span>, <span style="color: blue;">function </span>(json) { callback(json); }); } |
Why is ASP.NET MVC 3 Razor syntax used if we only have 1 ASP.NET page?
The project is set up as an ASP.NET MVC 3 project. Part of an MVC project feature-set is the ability to create Razor pages. Account at a Glance follows the project standard on how pages are served. Technically a single HTML page could be used, however in the case of future pages needing to be created, a Razor page is being used. ASP.NET MVC controller actions are also used to serve up data to the client.
If I wanted to add new tile, how would I do that?
To add a new tile, open the Scripts/scene.layoutservice.js file. The tiles are defined in the items variable. You’ll see a number of tiles already defined. Add a new entry to the end of the collection. The JSON object shown below is used to define the account details tile. The key properties of the JSON object include:
- name – This is the text that appears at the top of the tile
- titleId – The unique identifier of the title (note that this value is used to dynamically download the tile’s jQuery template from the server)
- formatter – Defines the data formatter that is called after the tile templates are rendered (if needed – otherwise null)
- scenes – Describes the two scenes that the tile can be displayed in including a standard scene (first scene in the array) and a cloud-view scene (second tile in the array).
Sample tile definition:
1 2 3 4 5 6 7 8 9 10 | { name: <span style="color: maroon;">'Account Details'</span>, tileId: <span style="color: maroon;">'AccountDetails'</span>, formatter: TileFormatter.formatAccountDetails, scenes: [ { height: s1mh, width: s1mw, top: 0, left: 0, opacity: 1, size: 1, borderColor: <span style="color: maroon;">'#5E1B6B'</span>, z:0 }, { height: 90, width: 210, top: 80, left: 250, size: 0, borderColor: <span style="color: maroon;">'#5E1B6B'</span>, z: <span style="color: maroon;">'2000'</span>, opacity: .5 } ] } |
To define the way the tile looks for the small, medium and large tiles, add an HTML file to the Templates folder in the AccountAtAGlance project. Ensure the name of the file is the same as the titleId property specified in the JSON. Within this file, copy the HTML shown next. Each script tag defines how the tile looks for the respective tile size.
1 | <span style="color: blue;">&lt;</span><span style="color: maroon;">script </span><span style="color: red;">id</span><span style="color: blue;">="YourTileId_Small" </span><span style="color: red;">type</span><span style="color: blue;">="text/x-jquery-tmpl"&gt; &lt;/</span><span style="color: maroon;">script</span><span style="color: blue;">&gt; &lt;</span><span style="color: maroon;">script </span><span style="color: red;">id</span><span style="color: blue;">="YourTileId_Medium" </span><span style="color: red;">type</span><span style="color: blue;">="text/x-jquery-tmpl"&gt; &lt;/</span><span style="color: maroon;">script</span><span style="color: blue;">&gt; &lt;</span><span style="color: maroon;">script </span><span style="color: red;">id</span><span style="color: blue;">="YourTileId_Large" </span><span style="color: red;">type</span><span style="color: blue;">="text/x-jquery-tmpl"&gt; &lt;/</span><span style="color: maroon;">script</span><span style="color: blue;">&gt; </span> |
Why does every tile have 3 templates?
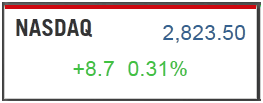
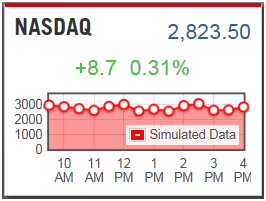
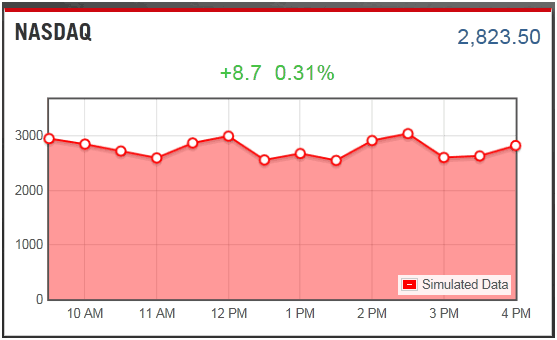
Three templates are used to define the different states of the tiles: small, medium, and large. When a tile is moved from one state to another the tile transitions to the target state. For example, consider the NASDAQ tile. Here are the three different states:
Base and Small
Medium
Large
Did you copy the Windows 8 tiles concept for this application?
Actually…no. The Account at a Glance application was built in March of 2011, well before any demos or screenshots of Windows 8 tiles were released by Microsoft. We chose tiles because Corey, Dan, Jarod, and John thought they made sense for presenting account data.
Special thanks to John Papa, Corey Schuman and Jarod Ferguson for their contributions to the Account at a Glance project. I had a great time working with everyone on the project!
You May Also Like
A Simple Introduction to Cisco CML2
0 3896 0Mark Jacob, Cisco Instructor, presents an introduction to Cisco Modeling Labs 2.0 or CML2.0, an upgrade to Cisco’s VIRL Personal Edition. Mark demonstrates Terminal Emulator access to console, as well as console access from within the CML2.0 product. Hello, I’m Mark Jacob, a Cisco Instructor and Network Instructor at Interface Technical Training. I’ve been using … Continue reading A Simple Introduction to Cisco CML2
Creating Dynamic DNS in Network Environments
0 642 1This content is from our CompTIA Network + Video Certification Training Course. Start training today! In this video, CompTIA Network + instructor Rick Trader teaches how to create Dynamic DNS zones in Network Environments. Video Transcription: Now that we’ve installed DNS, we’ve created our DNS zones, the next step is now, how do we produce those … Continue reading Creating Dynamic DNS in Network Environments
Cable Testers and How to Use them in Network Environments
0 727 1This content is from our CompTIA Network + Video Certification Training Course. Start training today! In this video, CompTIA Network + instructor Rick Trader demonstrates how to use cable testers in network environments. Let’s look at some tools that we can use to test our different cables in our environment. Cable Testers Properly Wired Connectivity … Continue reading Cable Testers and How to Use them in Network Environments



See what people are saying...