Cisco’s EIGRP metric – fact and not so fact

As a quick reminder from my previous blog post, let’s take a look at the full Enhanced Interior Gateway Routing Protocol (EIGRP) metric formula:
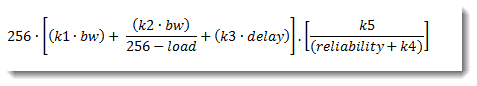
The EIGRP fomula simplifies (using default k-values) to:
256(min bandwidth + cumulative delay)
To determine min bandwidth and cumulative delay, use the following information:

Delay is computed as the cumulative delay end to end in tens of microseconds

Let’s dig a little deeper into the information surrounding the values used in this computation. I have a 2621XM router from which I will be grabbing some screen shots. Let’s examine the output of the command show interfaces FastEthernet 0/0:

If we focus our attention on the DLY portion of the output, we see that the units are in usec. The symbol for microseconds is actually the Greek letter Mu (pronounced ‘mew’) and it looks like this: µ As Cisco devices don’t speak Greek, the closest symbol which compares is the lower-case letter ‘u.’ Sometimes you gotta run what you brung.
Now let’s address another area about the EIGRP formula and the results shown on our devices. This topic too has been addressed by other bloggers, but I say again that I want to show the results in a format that is easy for the eyes to follow. There are some statements made in various publications which lead to confusion about how EIGRP computes the metric. It has been said that a router (let’s say Router A) can simply use the Advertised Distance from a neighbor (say Router B) and add the distance from A to B and that gives the full distance (called Feasible Distance) to the destination. This is not borne out by performing the computations manually and observing the result. Let’s see how this works.
Let’s say you have a network that looks like this:

A common statement regarding EIGRP metric calculation is that the Feasible Distance (FD) from a router to a destination is obtained by adding the costs of the individual links until the destination is reached. If that is the case, I should be able to calculate the cost from R1 – R2, the cost from R2 – R3, and the cost from R3 to the loopback destination, and then add them up to get the total FD. Let’s see if this works.
Since the default k-values have not been modified, we can use the simplified form of the metric calculation formula:
256(min bandwidth + cumulative delay)
Also, since we are only calculating the individual links, the minimum bandwidth is the actual bandwidth per link. Here we go:
For R1 to R2:

For R2 to R3:
The values are the same so the result is the same: 28160.

If the oft repeated statement noted above is true, we should be able to add the red values and obtain the FD from R1 to the 172.22.1.0 network on R3. Is it true?
28160 + 28160 + 128256 = 184576
The diagram would look like this:

Let’s view the relevant information from the output on R1 of the command: show ip eigrp topology

The actual FD obtained by R1 is 158720, not 184576. So it is NOT true that the FD can be found by finding the sum of all the links from source to destination.
Let’s see how R1 actually obtained the value of 158720.
First, let’s determine which values we would use to compute the metric if we were R1: What is the minimum bandwidth along the entire route to the destination? It turns out to be 100,000kbps. The individual delay values are 100µsec + 100µsec + 5000µsec. The formula uses these values in tens of microseconds, so let’s plug all this into the formula.

What conclusion do we draw from this? That each router in the chain must individually compute the metric for remote destinations.
Another common misconception is that if R1 knows R2’s metric to the destination (Advertised Distance), it can simply add its distance from R2 plus R2’s (AD) to the destination to obtain its own metric. This also is false. Let’s take a look:
Let’s first see what R2 has for AD to that remote network:

So far, it looks like this:

Again, if the statement were true, R1 would simply add its own distance from itself to R2 and R2’s AD to the remote destination to get its metric. Will this work?
As shown previously, the metric for the link from R1 to R2 is 28160.
The sum of these two values: 28160 + 156160 = 184320.
Once again, this does NOT equal the actual FD for R1 to the 172.22.1.0 network, as the FD is actually 158720.
The same conclusion reached before holds sway; that is, each router involved in the EIGRP domain individually runs the computation to obtain its metric. There is an excellent write-up in even more detail at The Cisco Learning Network EIGRP_Metric_Calculation_Demystified.pdf:
On this page is a link to download the .PDF version of this very complete article. Take a look. My goal today was to present in a way that is easy on the eyes. As I mentioned in my previous blog, sometimes math is difficult enough to follow without adding a bunch of nested parentheses, so I try to alleviate some of the pain. I hope I have succeeded.
Happy routing!


A Simple Introduction to Cisco CML2
Mark Jacob, Cisco Instructor, presents an introduction to Cisco Modeling Labs 2.0 or CML2.0, an upgrade to Cisco’s VIRL Personal Edition. Mark demonstrates Terminal Emulator access to console, as well as console access from within the CML2.0 product. Hello, I’m Mark Jacob, a Cisco Instructor and Network Instructor at Interface Technical Training. I’ve been using … Continue reading A Simple Introduction to Cisco CML2
Creating Dynamic DNS in Network Environments
This content is from our CompTIA Network + Video Certification Training Course. Start training today! In this video, CompTIA Network + instructor Rick Trader teaches how to create Dynamic DNS zones in Network Environments. Video Transcription: Now that we’ve installed DNS, we’ve created our DNS zones, the next step is now, how do we produce those … Continue reading Creating Dynamic DNS in Network Environments
Cable Testers and How to Use them in Network Environments
This content is from our CompTIA Network + Video Certification Training Course. Start training today! In this video, CompTIA Network + instructor Rick Trader demonstrates how to use cable testers in network environments. Let’s look at some tools that we can use to test our different cables in our environment. Cable Testers Properly Wired Connectivity … Continue reading Cable Testers and How to Use them in Network Environments
Pingback: 3.5 eigrp bw and dly table | ccie or die