See the instructor. Stay engaged.
Video Training for IT Professionals™
Video training for IT Professionals
IT professionals need to learn quickly and retain knowledge. We built video ‘teaching studios’ in order
to leverage our extensive live training expertise and the results are clear.

Teaching Studios
Leverage the tools that make our live training excellent.
Classroom Instructors
Our subject matter experts are also expert instructors.
Face to Face Matters
See the instructor. See the boards. See the gear.
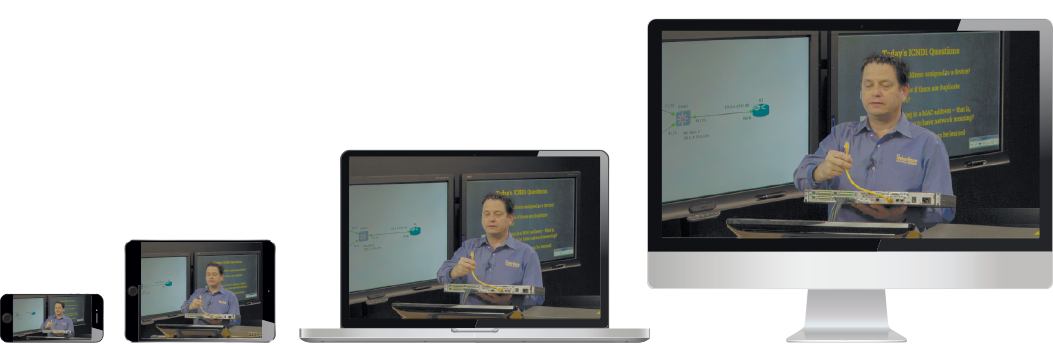
Maximum engagement on any device
Whether you need to get a certification or perform mission critical tasks, Interface video training
is designed to break preoccupation and build curiosity. The result is measurably higher knowledge retention.